


|
|

Distribution Summary Report
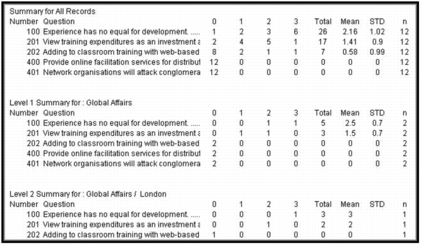
For each question, this report counts the number of respondents who voted for each of the possible response selections. For example, 2 people selected 1, 3 people selected 2, 6 people selected 3, etc. Results are reported for numerical values (1, 2, etc.) as opposed to text values (Strongly disagree, Disagree, etc.) as defined in the voting profile. The report includes the total score, mean, standard deviation (STD) and number of voters (n) for each question and the text of the question. "Did not respond" or "no opinion" responses are listed in this report but not included in the total, mean or standard deviation calculations.
 Distribution summary reportNOTE: An ASCII text report may appear jumbled due to the varying length of the questions, level descriptions, etc. The files are tab delimited and the data will line up correctly when opened up in a spreadsheet application.
|
Facilitate.com, Inc. Copyright 1992 - 2011, Facilitate.com, Inc. All Rights Reserved www.facilitate.com Voice: (805) 682-6939 support@facilitate.com |
|
|