


|
|

Dynamic Flash Graphs Report Options
FacilitatePro offers several dynamic Flash charts for alternate views of voting results including bar charts, column charts, pie charts and donut charts in both 2D and 3D formats. Individual Flash charts can be sliced or rotated before printing the HTML report. Individual Flash charts can be converted to JPG, PNG or PDF files for inserting into a document.To print a report of the voting results of a topic using Flash charts:1. Click the Print button in the voting results screen.2. In the Printing Options screen select the radio button for HTML Formatted Reports. Select Report II - Voting Distribution Graphs from the pull-down menu.3. Choose a Chart Type from the pull-down menu.4. Click the Print Preview button to display the formatted report.5. Right click on individual pie or donut charts to slice or rotate.Send the report directly to your printer. Click the Back button on the Web browser to return to the Printing Options page.NOTE: For Flash charts to display, all participants and facilitators need to have two lines of JavaScript code added to the <head> section of their toolbars:
<script language="JavaScript" src="/FusionCharts/Charts/FusionCharts.js"></script>
<script language="JavaScript" src="/FusionCharts/Charts/FusionChartsExportComponent.js"> </script>NOTE: Non-Flash formats of the voting graphs are available when Flash is unavailable or disabled.NOTE: Flash charts cannot be copied and pasted into an MS Word document directly. First save individual graphs as JPG or PNG formats and then insert into a document. Alternatively, take a snapshot of a graphic and copy the individual chart image into any document. Future releases of FacilitatePro will provide additional printing and display options for these Flash charts.
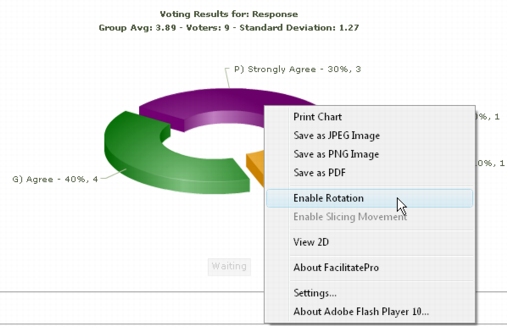 Graphed Voting Results - Flash Chart - Printing, Saving, Rotation and Slicing Movement Options
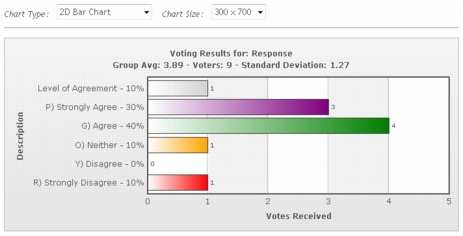 Graphed Voting Results - Flash Chart - 2D Bar Chart
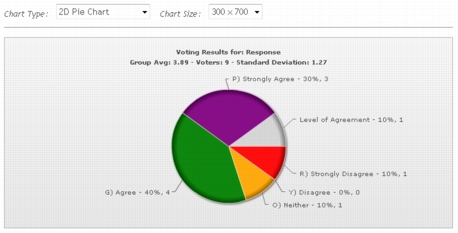 Graphed Voting Results - Flash Chart - 2D Pie Chart
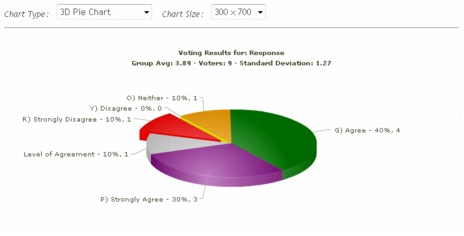 Graphed Voting Results - Flash Graphic - 3D Pie Chart - Sliced and Rotated
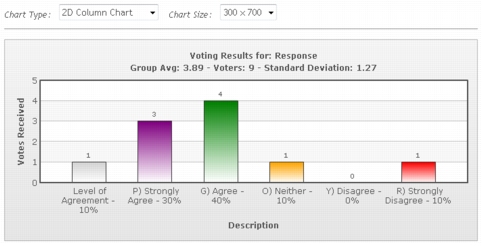 Graphed Voting Results - Flash Chart - 2D Column Chart
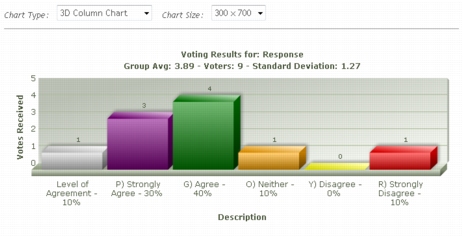 Graphed Voting Results - Flash Chart - 3D Column Chart
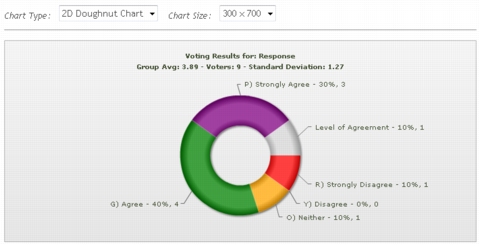 Graphed Voting Results - Flash Chart - 2D Donut Chart
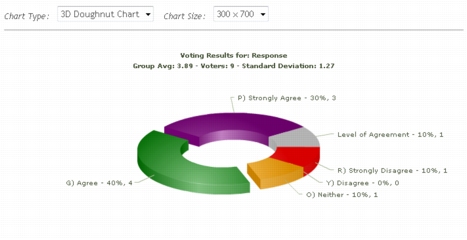 Graphed Voting Results - Flash Chart - 3D Donut Chart - Sliced
|
Facilitate.com, Inc. Copyright 1992 - 2011, Facilitate.com, Inc. All Rights Reserved www.facilitate.com Voice: (805) 682-6939 support@facilitate.com |
|
|