


|
|

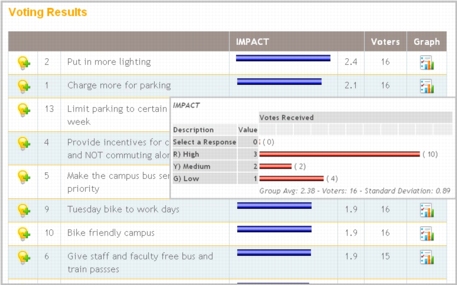
Viewing Voting Results
As soon as everyone has voted, the tabulated data is instantly available and the group begins to evaluate the results. Items are automatically sorted within Categories (if used) according to the voting results, from highest to lowest average score.The graph icon next to each item displays the distribution of votes. Voting distribution is often used to understand the degree of consensus in the group. If more evaluation or greater consensus is needed, the group can brainstorm, discuss and then vote again with different voting schemes, until a decision is reached.
 Viewing Voting Results
|
Facilitate.com, Inc. Copyright 1992 - 2011, Facilitate.com, Inc. All Rights Reserved www.facilitate.com Voice: (805) 682-6939 support@facilitate.com |
|
|