


|
|

Voting Results - Distribution Graphs & Voting Comments
Click on the graph icon next to an item in the voting results table to view voting distribution graphs and voting comments.
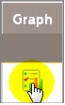 View Graph for Each Item
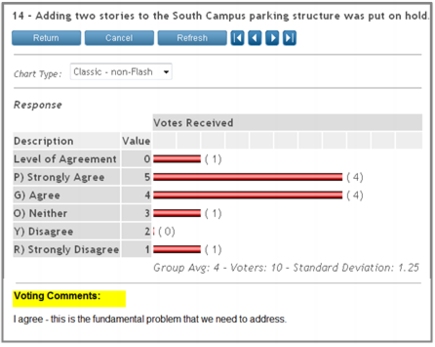 Voting Distribution Graph (Voting Comments display below)Select from the various chart options, including dynamic Flash charts, and click on the Refresh button to view data in a variety of different formats.
|
Facilitate.com, Inc. Copyright 1992 - 2011, Facilitate.com, Inc. All Rights Reserved www.facilitate.com Voice: (805) 682-6939 support@facilitate.com |
|
|